
Increasing number of retirees are looking for properties in Nevada
More than 338,000 Americans moved to retire in 2023, an increase of 44% compared to 2022 California has the highest share of retirees moving to...
More than 338,000 Americans moved to retire in 2023, an increase of 44% compared to 2022 California has the highest share of retirees moving to...
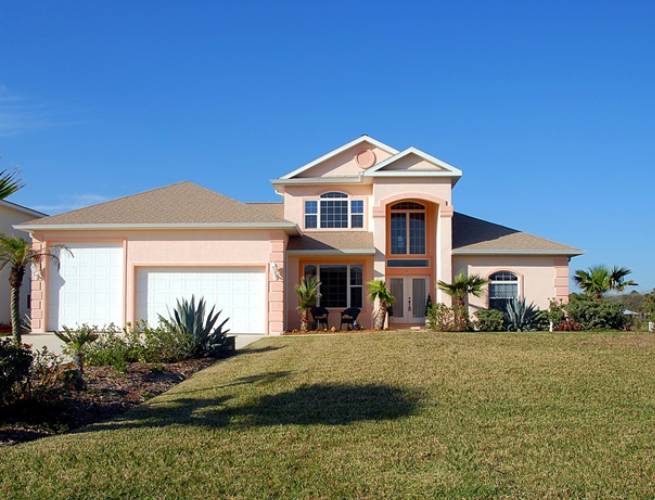
Is your family’s life exposed through open windows and bare landscaping? If you answered “yes” to this question, then it would be wise to invest in a few good landscaping modifications. Options like shrubbery and low-voltage lighting will not only help keep you and your family safe during these unprecedented times...

My Take: We’re now four months into 2016—let’s see how the market is doing.This week I decided to look at number of houses sold and closed since January 1st (only sold on the MLS) and maximum and minimum prices in each cities—here’s what I found: Palo Alto: 95 houses sold & closed; High/Low = $10,495,000 / $1,325,000Menlo Park: 76 houses sold & closed; High/Low = $6,172,500 / $802,000Redwood City: 111 houses sold & closed; High/Low = $3,675,000 / $699,000Mountain View: 57 houses sold & closed; High/Low = $3,660,000 / $1,235,000Los Altos: 65 houses sold & closed; High/Low = $4,950,000 / $1,075,000Sunnyvale: 154 houses sold & closed; High/Low =...

Los Altos, Menlo Park, Mountain View, Palo Alto, and Sunnyvale Want to know the most popular price range in which houses are selling in the cities I’m tracking? Look no farther than the chart below! I was amazed to see which range was the most active! These numbers are reflective of the past year. How is this information useful? Well, think of the price you’re pre approved for on your purchase, or wish to purchase in, and you’ll be able to figure how competitive your market is… Goes without saying, these numbers need a few zeros after them! This is the...

My take: We’re beginning March and inventory continues to be low. The Super Bowl is over, Valentine’s Day is done with and so are the Oscars but I don’t think sellers are aware that for real estate to be humming along we need folk to list their houses! The above core Silicon Valley cities continue to be valued real estate and highly sought after. Why is inventory so low? Good question! I think the #1 response is that sellers need a place to live once they sell their home and move up is tough. Sellers are in a hard place—once...