Bay Area Realtor Blog

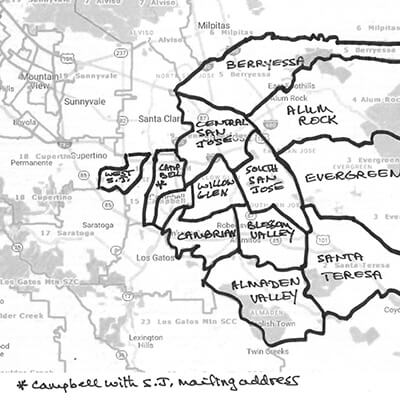
I often get asked about the difference between Counties; primarily on the Peninsula we have Santa Clara and San Mateo Counties. San Mateo County is basically South San Francisco to Menlo Park.Santa Clara County is Palo Alto down to Gilroy. And then there are cities like Watsonville that the Multiple Listing Service covers over three counties (a little confusing!). Parts of Palo Alto can be in Santa Clara or San Mateo Counties!!!  Here’s a chart showing four counties and the medium sale prices (houses only), with the largest percent gain shown in 2018 over 2017; I was surprised to see the 20% gain...

The most common questions I’ve been asked recently are “How’s the market?” and “Does the Government shutdown affect the real estate market?” As always it depends on location.  I decided to look at average sales prices to get more specific in my reply. Take a look at the tables here giving information between houses and townhomes/condos over the four quarters last year. For example, with houses, we saw big gains in Los Altos, Palo Alto, and Los Gatos, though neither Los Altos nor Palo Alto held onto said gains, both ended with 4th quarter average sales below their 1st...

Since 2018 marks the 40th anniversary of the passage of Proposition 13 in 1978, and the deadline for property tax payments is coming up, I thought some FUN FACTS from the Santa Clara and San Mateo County Tax Assessors Offices would be appropriate as we close out 2018: Santa Clara County: *The 2018-19 Assessor's Annual report details Santa Clara County's longest post-recession recovery, well into its eight year since 2009; the annual assessment roll increased by $33 billion to $483.2 billion, a 7.34 percent increase over the prior year. *Just over half the $33 billion increase in assessed value was attributable to...

At 54.4% California is the second lowest in the nation for home ownership, beat out only by New York at around 50%.  Best state for home ownership is West Virginia where approximately 75% of homes are owner occupied.  What this means is California is fast becoming a majority renter state, basically pricing itself out of the home ownership future.  One obvious answer is to build more housing; to do this we need to address the "not in my back yard" issue so prevalent in many cities.  Overall, California's projected housing needs stand at 180,000 units a year, this is...

I've had a lot of people ask me about what's happening now with the housing market; as always, my reply is "it depends on where the house is located!" There's no doubt that the market has cooled a bit, this trend started after home prices peaked around April/May and has continued.  The latest housing and economic forecast released by the California Association of REALTORS® indicates high home prices, eroding affordability, buyer fatigue, and the volatility of stocks are prompting buyers to wait in the sidelines. It's a well known fact buyers feel confident buying when there's a lot of interest,...

This week I thought to look at some different statistics; I usually look at housing information, data on list vs. sale prices, or days on market but this time I looked at the Census site and found all sorts of quirky interesting information so thought I’d share! Take a look at the charts to see who your neighbors are! For those of you not interested in looking at charts, here’s the info in another form: ...

I’ve been asked to break San Jose down into its respective areas; basically San Jose can be divided into 12 areas including areas like Rose Garden and Naglee Park. San Jose covers a huge area so it does need its own post! Looking at the chart above for houses only, you can see that with 91 houses for sale, Alum Rock has the largest inventory, it’s also the area with the lowest average sale price to date of $855,227, followed closely by South San Jose at $869,266; there’s huge opportunity in Alum Rock and South San Jose. West San Jose and Almaden...

While at an open house recently, I had a prospective buyer ask me about the difference in traffic patterns and how commutes affect housing prices.  We talked about traffic, how much time folk spend in their cars driving to/from work, more affordable housing, and how Bay area house prices reflect location i.e., good schools and a shorter commute.  In answering her questions, I got to thinking about commutes; I totally understand how impossible 101, 280, 87, and 85 are during certain hours but wasn't too sure about the greater picture, so I did some research and found the most congested...

As a member of the Silicon Valley Association of Realtors (SILVAR), I read the Press Releases they put out on a variety of subjects related to housing; a recent release ties in to what I wrote about last week, namely traffic and housing!  The President and CEO of SILVAR commented on data showing traffic has increased 84% in the last 10 years and jobs have grown 29% from 2010-2016, yet new housing has only increased 4%.  This lack of housing, let alone affordable housing, may very well put the Bay area at a disadvantage as companies look for new...

OMG, take a look at these numbers, talk about appreciation! Yes, these are our homes and they're also our biggest financial investment. It's no surprise, yet still interesting, to see that the cities with the highest value are Palo Alto, Los Altos, and Saratoga for single family houses and Palo Alto, Los Altos, and Menlo Park for townhomes and condos.  Looking at this data, we can see that as house prices have soared, buyers have turned to townhomes and condos as alternatives with the result that those properties are now extremely high too! The numbers for San Jose don't really do...