San Jose Housing Sales Breakdown
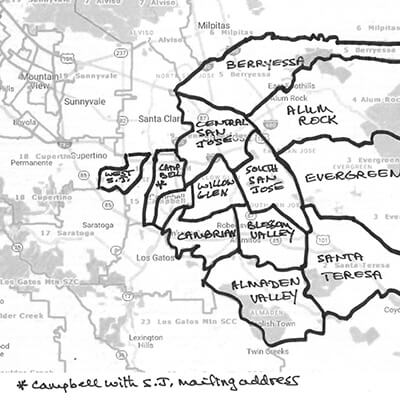
 I’ve been asked to break San Jose down into its respective areas; basically San Jose can be divided into 12 areas including areas like Rose Garden and Naglee Park. San Jose covers a huge area so it does need its own post! Looking at the chart above for houses only, you can see that with 91 houses for sale, Alum Rock has the largest inventory, it’s also the area with the lowest average sale price to date of $855,227, followed closely by South San Jose at $869,266; there’s huge opportunity in Alum Rock and South San Jose. West San Jose and Almaden Valley lead the way in highest average sale prices. Top three areas with the largest gain are West San Jose, tied are Evergreen/Willow Glen and then Central San Jose. I’ve told my clients for quite a while that the areas to watch are the 101, 280, 87, and 85 corridors; yes, you’ve got it, we’re all looking for a reasonable commute!

The chart below is for townhomes and condos only; you can see that with 66 units for sale, Blossom Valley has the largest inventory with West San Jose the least at 5 units. The area with the lowest average sale price to date of $560,711 is Alum Rock. As for houses, West San Jose and Almaden Valley lead the way in highest average sale prices. Top three areas with the largest gain are Berryessa with a whopping $186,635 gain over 2017, followed by the San Jose part of Campbell, and then West San Jose.

NB: The data above reflects the whole of 2017 while 2018 is YTD to end of September

Just the Facts Ma’am!
Covering Silicon Valley. All information from the Multiple Listing Service.
Want information for other areas? Comments? Questions? Send me a message, I’d love to hear from you!