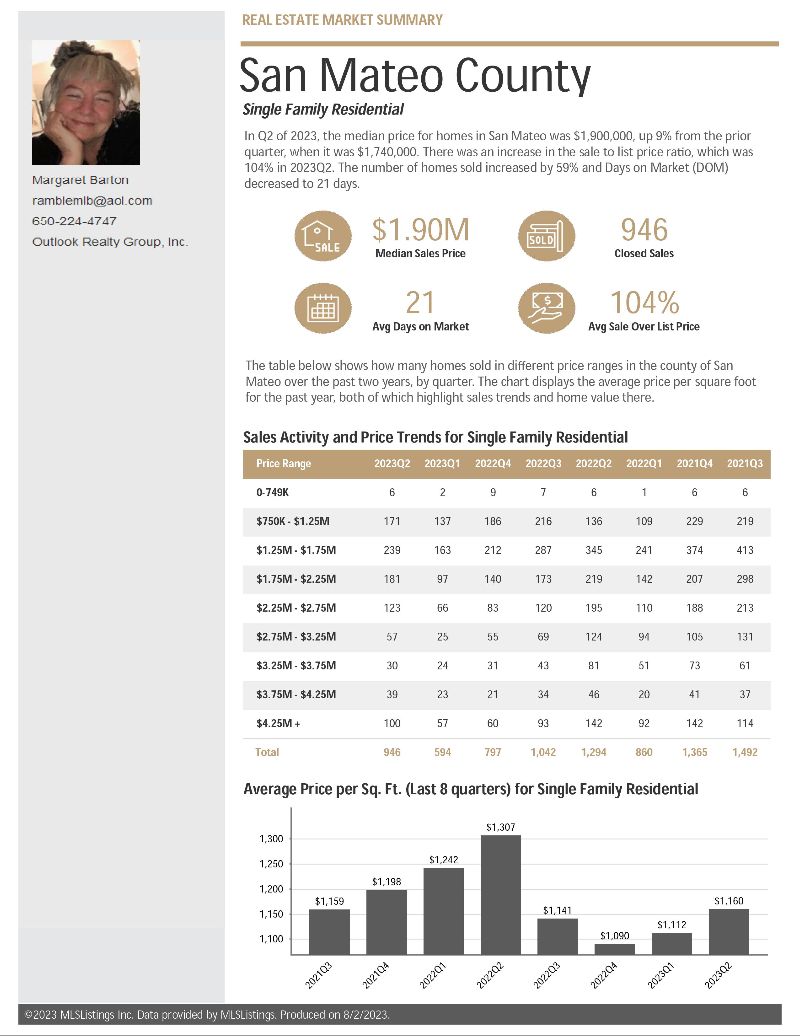
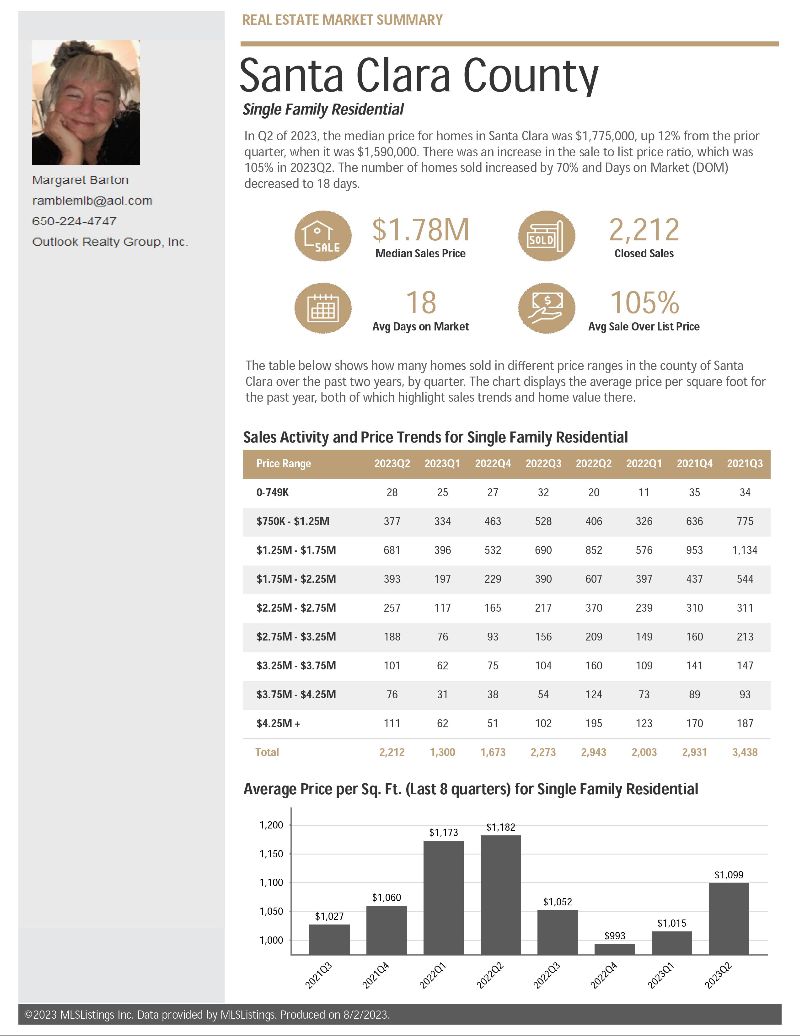
* You can see at a glance the number of homes sold within the different price points. For example, if you have a budget of $750,000 and under, there were more homes sold in Santa Clara County (28) than San Mateo County (6). This is useful to know within any price point.
* In Santa Clara County the most houses sold (681) were in the price range of $1,250,000 – $1,750,000; in San Mateo County there were 239 houses sold in the same range, that’s the price range you’ll find the most competition for both counties, the difference is you’ll have more choice in Santa Clara County.
* Looking at the average price per square foot trend for the last 8 quarters: in Santa Clara County home sale prices for the last quarter was $1,099SF (down from a high of $1,182SF in 2022). Compare this to San Mateo County where the last quarter average sale prices were $1,160SF (down from a high of $1,307SF in 2022)
This information is very helpful for buyers looking to learn more about availability of homes at certain price points and/or how stiff the competition may be.
This data is taken from the MLS and is based on the last complete quarter. If you’re looking for information specific to a city, text me at 650-224-4747 and I’ll get it for you.