
Real Estate Market Changeable since 2018
The new year is always a good time to reflect and review, so I’ve done just that! With the real estate market so changeable in 2018, I’ve taken a look at what’s happened over the past 5 years and noticed the following which I think is noteworthy (you can look at the charts themselves to get more information). By request, I’ve started to include more cities in my charts and have broken San Jose down into its respective areas as there is such a price difference depending on where in San Jose you buy. Here are my observations:
- Look at the huge jump in values in 2018! This reflected the crazy high market we saw in the first half followed by a significant drop in the last quarter, talk about a sudden turn from a seller to a buyer’s market!
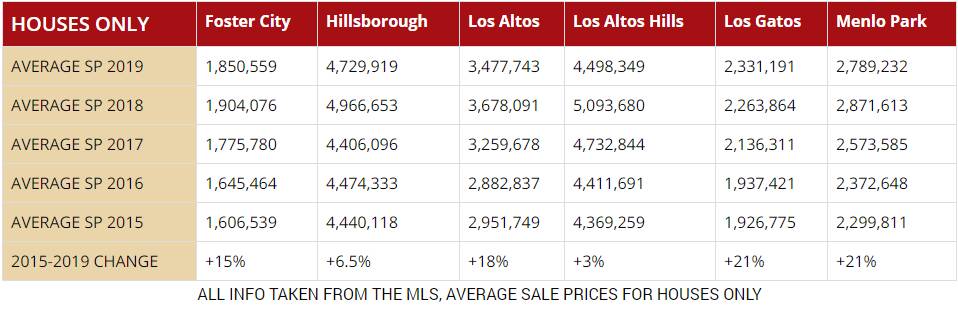
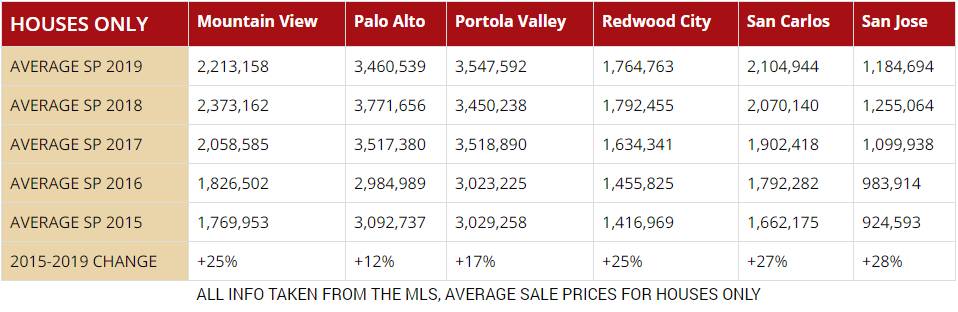
- After 2018, of the 22 cities I’m following, only 5 increased in value in 2019, all the others dropped in price: Atherton, Burlingame, Los Gatos, Portola Valley, and San Carlos are the ones which continued to rise in price in 2019.
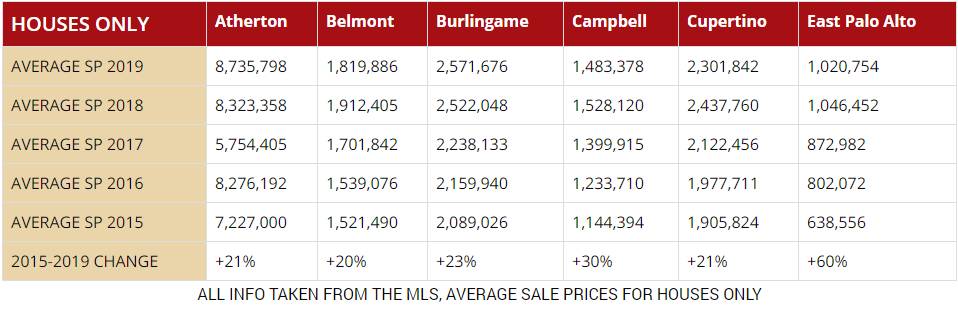
- Atherton leads the way in average sale price with a stunning $8,735,798 in 2019 compared to $7,227,000 in 2015, an increase of 21%
- East Palo Alto has been undervalued for so long and at last is increasing in value. It’s still possible to buy a house there for well under a million, but with an increase of 60% in average sale prices the last 5 years, those days may not last for much longer!
- Looking at the different areas in San Jose you can see the highest priced areas are: West San Jose, Almaden Valley, Willow Glen, and Evergreen, all areas with either good schools or a shorter commute
- As far as appreciation goes, South San Jose (+29%), Alum Rock (+27%), and Central San Jose (+26%), lead the way.
I don’t have a crystal ball for 2020 and it’ll be interesting to see what the year brings; after talking with other agents and from my own experience, I can tell you we’ve started the year with a bang with reasonably priced homes getting multiple offers at a lot higher prices. There continues to be huge demand for properties and the slight slow down we’ve seen since the fall of 2018 which has given many buyers a chance to enter the market, may have peaked. Sellers are more realistic in their expectations and list prices, so few properties are sitting very long. If you’re looking to buy or sell a home in 2020, give me a call and let’s talk, I’d love to help you.
| HOUSES ONLY | Atherton | Belmont | Burlingame | Campbell | Cupertino | East Palo Alto |
|---|---|---|---|---|---|---|
| AVERAGE SP 2019 | 8,735,798 | 1,819,886 | 2,571,676 | 1,483,378 | 2,301,842 | 1,020,754 |
| AVERAGE SP 2018 | 8,323,358 | 1,912,405 | 2,522,048 | 1,528,120 | 2,437,760 | 1,046,452 |
| AVERAGE SP 2017 | 5,754,405 | 1,701,842 | 2,238,133 | 1,399,915 | 2,122,456 | 872,982 |
| AVERAGE SP 2016 | 8,276,192 | 1,539,076 | 2,159,940 | 1,233,710 | 1,977,711 | 802,072 |
| AVERAGE SP 2015 | 7,227,000 | 1,521,490 | 2,089,026 | 1,144,394 | 1,905,824 | 638,556 |
| 2015-2019 CHANGE | +21% | +20% | +23% | +30% | +21% | +60% |
ALL INFO TAKEN FROM THE MLS, AVERAGE SALE PRICES FOR HOUSES ONLY
| HOUSES ONLY | Foster City | Hillsborough | Los Altos | Los Altos Hills | Los Gatos | Menlo Park |
|---|---|---|---|---|---|---|
| AVERAGE SP 2019 | 1,850,559 | 4,729,919 | 3,477,743 | 4,498,349 | 2,331,191 | 2,789,232 |
| AVERAGE SP 2018 | 1,904,076 | 4,966,653 | 3,678,091 | 5,093,680 | 2,263,864 | 2,871,613 |
| AVERAGE SP 2017 | 1,775,780 | 4,406,096 | 3,259,678 | 4,732,844 | 2,136,311 | 2,573,585 |
| AVERAGE SP 2016 | 1,645,464 | 4,474,333 | 2,882,837 | 4,411,691 | 1,937,421 | 2,372,648 |
| AVERAGE SP 2015 | 1,606,539 | 4,440,118 | 2,951,749 | 4,369,259 | 1,926,775 | 2,299,811 |
| 2015-2019 CHANGE | +15% | +6.5% | +18% | +3% | +21% | +21% |
ALL INFO TAKEN FROM THE MLS, AVERAGE SALE PRICES FOR HOUSES ONLY
| HOUSES ONLY | Mountain View | Palo Alto | Portola Valley | Redwood City | San Carlos | San Jose |
|---|---|---|---|---|---|---|
| AVERAGE SP 2019 | 2,213,158 | 3,460,539 | 3,547,592 | 1,764,763 | 2,104,944 | 1,184,694 |
| AVERAGE SP 2018 | 2,373,162 | 3,771,656 | 3,450,238 | 1,792,455 | 2,070,140 | 1,255,064 |
| AVERAGE SP 2017 | 2,058,585 | 3,517,380 | 3,518,890 | 1,634,341 | 1,902,418 | 1,099,938 |
| AVERAGE SP 2016 | 1,826,502 | 2,984,989 | 3,023,225 | 1,455,825 | 1,792,282 | 983,914 |
| AVERAGE SP 2015 | 1,769,953 | 3,092,737 | 3,029,258 | 1,416,969 | 1,662,175 | 924,593 |
| 2015-2019 CHANGE | +25% | +12% | +17% | +25% | +27% | +28% |
ALL INFO TAKEN FROM THE MLS, AVERAGE SALE PRICES FOR HOUSES ONLY
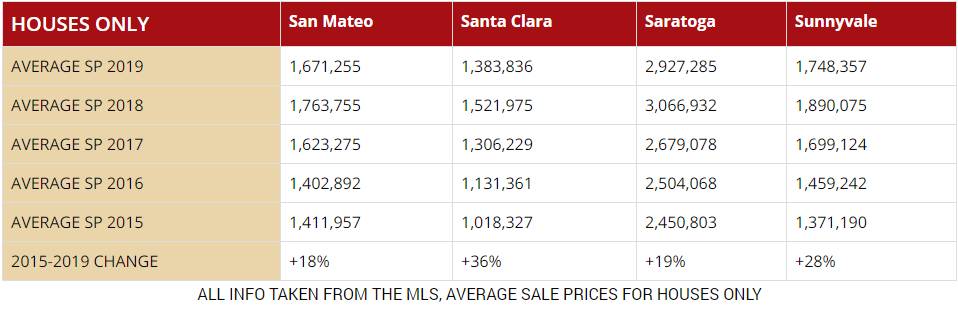
| HOUSES ONLY | San Mateo | Santa Clara | Saratoga | Sunnyvale |
|---|---|---|---|---|
| AVERAGE SP 2019 | 1,671,255 | 1,383,836 | 2,927,285 | 1,748,357 |
| AVERAGE SP 2018 | 1,763,755 | 1,521,975 | 3,066,932 | 1,890,075 |
| AVERAGE SP 2017 | 1,623,275 | 1,306,229 | 2,679,078 | 1,699,124 |
| AVERAGE SP 2016 | 1,402,892 | 1,131,361 | 2,504,068 | 1,459,242 |
| AVERAGE SP 2015 | 1,411,957 | 1,018,327 | 2,450,803 | 1,371,190 |
| 2015-2019 CHANGE | +18% | +36% | +19% | +28% |
ALL INFO TAKEN FROM THE MLS, AVERAGE SALE PRICES FOR HOUSES ONLY